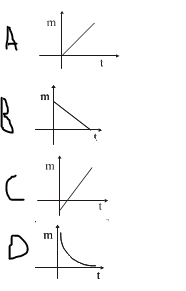
Which of the following graphs correctly represents the variation of mass of a given material deposited with time for constant current in Faraday's Law of Electrolysis?


According to Faraday's Law, the mass of the substance deposited is directly proportional to the time for which the current flows, assuming a constant current. Therefore, the graph should show a linear increase in mass over time, which corresponds to option A
There is an explanation video available below.

Contributions ({{ comment_count }})
Please wait...
Modal title
Report
Block User
{{ feedback_modal_data.title }}