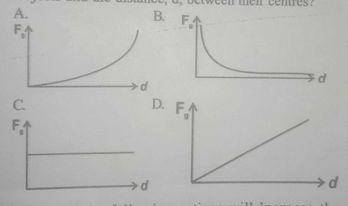
Which of the sketched graphs above illustrates the correct variation of the gravitational force, Fg between two objects and the distance, d, between the centre
a
A
b
B
c
C
d
D
Explanation
Correct Option
bVideo Explanation
No video available
Post your Contribution
Share:

 ♂️
♂️


