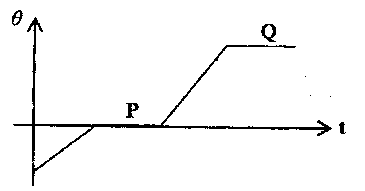
The graph above illustrates the variation of temperature \(\theta\) with time (t) for a solid that is being heated. Which processes take place at segments P and Q respectively?

a
Freezing and vaporization
b
Evaporation and solidification
c
Melting and boiling
d
Condensation and evaporation
Explanation
Correct Option
cVideo Explanation
No video available
Post your Contribution
Share: