(a) Explain the terms:- uniform acceleration and average speed.
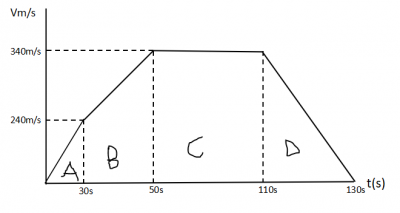
(b) A body at rest is given an initial uniform acceleration of 8.0ms\(^{-2}\) for 30s after which the acceleration is reduced to 5.0ms\(^{-2}\) for the next 20s. The body maintains the speed attained for 60s after which it is brought to rest in 20s. Draw the velocity-time graph of the motion using the information given above.
(c) Using the graph, calculate the: (i) maximum speed attained during the motion; (ii) average retardation as the body is being brought to rest; (iii) total distance travelled during the first 50s; (iv) average speed during the same interval as in (ii).
Explanation
Video Explanation
No video available
Post your Contribution
Discussions (13)

A question like this was solved in waec theory 2009 number 9, with a different approach. I believe that approach is correct. Because there are some values solved here without proof.
Please this yout solving in velocity time graph is totally wrong. its not 200m/s
Please revisit and check

Uniform acceleration refers to a situation where an object's velocity changes at a constant rate over time. In other words, the object's speed increases or decreases by the same amount during each equal interval of time. For example, if a car accelerates from 0 to 60 mph in 10 seconds, then it is experiencing a uniform acceleration of 6 mph per second.
Average speed, on the other hand, is the total distance traveled by an object divided by the total time taken to travel that distance. It is a measure of the overall speed of the object during the entire journey. For example, if a car travels 120 miles in 2 hours, then its average speed would be 60 miles per hour.
It is important to note that average speed does not take into account any variations in speed that may have occurred during the journey. Therefore, an object that travels at a constant speed will have the same average speed as its constant speed, while an object that travels at varying speeds will have an average speed that is somewhere between its maximum and minimum speeds.
but I'm kinda confuse about how the second distance is a trapezium instead of a square
If a body's acceleration is reduced, it does not necessarily mean it is decelerating. It can mean that the body is still accelerating, but at a lesser rate than before. Here’s a breakdown:
To draw the velocity-time graph based on the given motion information, we need to calculate the velocities at different time intervals and plot them accordingly.
1. **Initial acceleration phase (0 to 30 seconds):**
- Initial velocity (\( u \)) = 0 m/s
- Acceleration (\( a \)) = 8.0 m/s²
- Time (\( t \)) = 30 s
Using the equation \( v = u + at \):
v1= 0 + 8.0 x 30 = 240 m/s
2. **Second acceleration phase (30 to 50 seconds):**
- Initial velocity (\( v_1 \)) = 240 m/s (from the previous phase)
- Acceleration (\( a \)) = 5.0 m/s²
- Time (\( t \)) = 20 s
Using the equation \( v = u + at \):
v2 = 240 + 5.0 x 20 = 240 + 100 = 340m/s
3. **Constant velocity phase (50 to 110 seconds):**
- Velocity remains constant at 340 m/s for 60 seconds.
4. **Deceleration phase (110 to 130 seconds):**
- Initial velocity (\( v2 \)) = 340 m/s
- Final velocity (\( v_f \)) = 0 m/s
- Time (\( t \)) = 20 s
Using the equation \( vf = v2 + a t
We need to find the deceleration (\( a \)). Rearranging the equation for acceleration:
0 = 340 + a x 20. a = -340/20 = -17m/s²
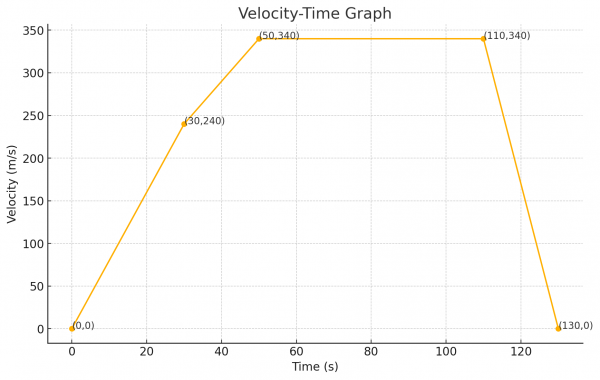
Using this information, let's plot the velocity-time graph:
1. **From 0 to 30 seconds**: Linearly increasing from 0 m/s to 240 m/s.
2. **From 30 to 50 seconds**: Linearly increasing from 240 m/s to 340 m/s.
3. **From 50 to 110 seconds**: Horizontal line at 340 m/s.
4. **From 110 to 130 seconds**: Linearly decreasing from 340 m/s to 0 m/s.

The other velocity is not 200m/s it is 240m/s .
Explanation
5=(240-u)÷20
You will get your initial velocity to be 140 not 200 pls check again and correct.
To draw the velocity-time graph based on the given motion information, we need to calculate the velocities at different time intervals and plot them accordingly.
1. **Initial acceleration phase (0 to 30 seconds):**
- Initial velocity (\( u \)) = 0 m/s
- Acceleration (\( a \)) = 8.0 m/s²
- Time (\( t \)) = 30 s
Using the equation \( v = u + at \):
v1= 0 + 8.0 x 30 = 240 m/s
2. **Second acceleration phase (30 to 50 seconds):**
- Initial velocity (\( v_1 \)) = 240 m/s (from the previous phase)
- Acceleration (\( a \)) = 5.0 m/s²
- Time (\( t \)) = 20 s
Using the equation \( v = u + at \):
v2 = 240 + 5.0 x 20 = 240 + 100 = 340m/s
3. **Constant velocity phase (50 to 110 seconds):**
- Velocity remains constant at 340 m/s for 60 seconds.
4. **Deceleration phase (110 to 130 seconds):**
- Initial velocity (\( v2 \)) = 340 m/s
- Final velocity (\( v_f \)) = 0 m/s
- Time (\( t \)) = 20 s
Using the equation \( vf = v2 + a t
We need to find the deceleration (\( a \)). Rearranging the equation for acceleration:
0 = 340 + a x 20. a = -340/20 = -17m/s²
Using this information, let's plot the velocity-time graph:
1. **From 0 to 30 seconds**: Linearly increasing from 0 m/s to 240 m/s.
2. **From 30 to 50 seconds**: Linearly increasing from 240 m/s to 340 m/s.
3. **From 50 to 110 seconds**: Horizontal line at 340 m/s.
4. **From 110 to 130 seconds**: Linearly decreasing from 340 m/s to 0 m/s.
I'll create the graph based on these points.
Second velocity should be 100m/s while we should have second 140m/s as our
reduced velocity on the graph instead of 200 drafted in the answer.

