The diagram above represents the graph of electron energy against the frequency of the radiation incident on a metal surface. Interpret the: (a) slope of the graph; (b) intercept, OC; (c) intercept, OK.
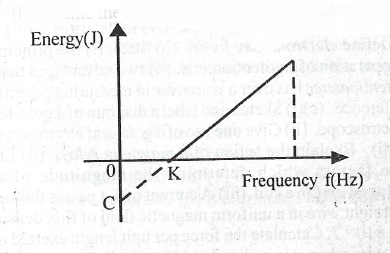


(a) Graph slope represents Planck's constant.
(b) Intercept OC represents work function of the metal.
(c) Intercept OK represents the threshold frequency F\(_o\) of the incident radiation


Contributions ({{ comment_count }})
Please wait...
Modal title
Report
Block User
{{ feedback_modal_data.title }}