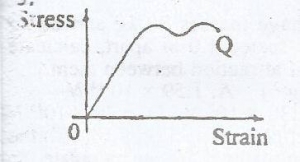
The diagram given, represents the graph of stress against strain for an elastic wire. The point Q on the graph is the
a
elastic linit
b
breaking point
c
yield point
d
proportional limit
Explanation
Correct Option
bVideo Explanation
No video available
Post your Contribution
Share:
Discussions (3)

Bournfray
7 years ago
Q is the breaking point because the elastic wire has reach the yield point and can no longer strain.


