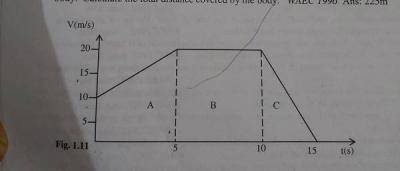
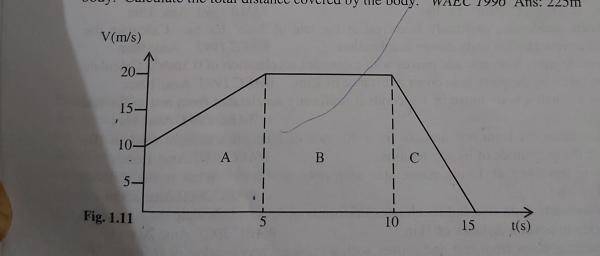
The diagram above illustrates the velocity-time graph of the motion of a body. Calculate the total distance covered by the body
a
50m
b
65m
c
175m
d
225m
e
300m
Explanation
Correct Option
dVideo Explanation
No video available
Post your Contribution
Share:
Discussions (15)


Adaezeq
5 years ago
They said the diagram above shows a velocity time graph, but i'm not seeing any diagram

Aishaadebola
4 years ago
the diagram is showing here, the ans is incorrect.
mistake is from A, its 1/2(20-10)*5 not 20+10


