

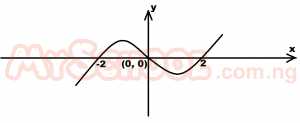
The diagram above is the graph of the function f(x). Determine the range of values of x for which f(x) \(\leq\) 0


The graph of the function f(x) is a curve that starts at (-2,0) and ends at (2,0) with a peak at (0,1). The range of values of x for which f(x) ≤ 0 is the interval where the function's graph is above or touches the x-axis. From the given graph, we can see that this interval is [-2, 2]. Therefore, the correct answer is x \(\leq\) - 2, 0 \(\leq\) x \(\leq\) 2
There is an explanation video available below.


Contributions ({{ comment_count }})
Please wait...
Modal title
Report
Block User
{{ feedback_modal_data.title }}