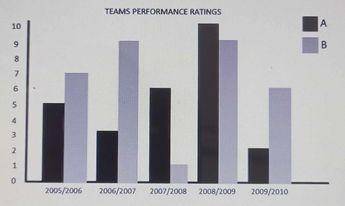
The graph above depicts the performance ratings of two sports teams A and B in five different seasons

In the last five seasons, what was the difference in the average performance ratings between Team B and Team A?

a

1.2

b

6.4

c

4.6

d

1.8

Download Offline App Ask a Question

Explanation

Correct Option
a

Video Explanation

Post your Contribution

Share:

Discussions (5)

Wisgovic
2 years ago

No diagram

Sensei
1 month ago

so average is same thing as mean.

Odemosad
1 year ago

Correct 👍

Sensei
2 months ago

correct

Quick Questions

Ask a Question
CO

ceoofwahala

20th June, 2026

Chemistry


2 comments

ASSAAS

20th June, 2026

English Language


5 comments

infinitehoaxx

21st May, 2026

Computer


4 comments