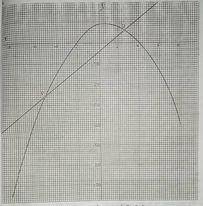
The graph shows the relation of the form y = mx\(^2\) + nx + r, where m, n and r are constants.
Using the graph:
(a) state the scale used on both axes; (b) find the values of m, n and r; (c) find the gradient of the line through P and Q; (d) state the range of values of x for which y > Q.
Explanation
Video Explanation
No video available
Post your Contribution
Share:
Discussions (3)

Chrisbridge
2 years ago
Please, the answer to part (c) is not correct. The graph shown above is the graph of a curve and a straight line. The points of intersection of both the line and the curve gives the solutions of the the quadratic equation mx^2 + nx + r.
the values of x here are x = -5 and 3

