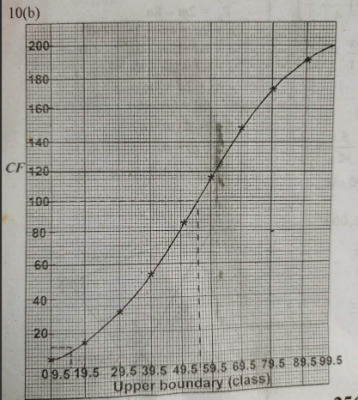
The table shows the distribution of marks obtained by students in an examination.
| Marks (%) | 0 - 9 | 10 - 19 | 20 - 29 | 30 - 39 | 40 - 49 | 50 - 59 | 60 - 69 | 70 - 79 | 80 - 89 | 90 - 99 |
| Frequency | 7 | 11 | 17 | 20 | 29 | 34 | 30 | 25 | 21 | 6 |
(a) Construct a cumulative frequency table for the distribution.
(b) Draw the cumulative frequency curve for the distribution.
(c) Using the curve, find correct to one decimal place, the:
(i) median mark;
(ii) lowest mark for the distinction if 5% of the students passed with distinction
Explanation
Video Explanation
No video available
Post your Contribution
Share:


