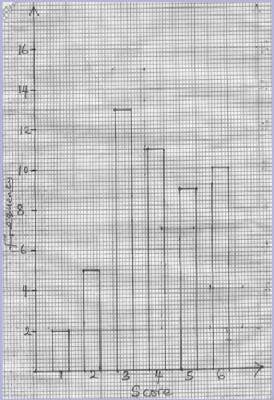
The table shows the distribution of sources obtained when a fair diwe was rolled 50 times.
| Score | 1 | 2 | 3 | 4 | 5 | 6 |
| Frequency | 2 | 5 | 13 | 11 | 9 | 10 |
1. Draw a bar chart for the distribution
2. Calculate the mean score of the distribution
Explanation
Video Explanation
No video available
Post your Contribution
Share:


