The table below shows the frequency distribution of the marks scored by fifty students in an examination.
| Marks (%) | 0-9 | 10-19 | 20-29 | 30-39 | 40-49 | 50-59 | 60-69 | 70-79 | 80-89 | 90-99 |
| Freq | 2 | 3 | 4 | 6 | 13 | 10 | 5 | 3 | 2 | 2 |
(a) Draw the cumulative frequency curve for the distribution.
(b) Use your curve to estimate the : (i) upper quartile; (ii) pass mark if 60% of the students passed.


| Marks |
Upper class boundary |
Freq | Cum Freq |
| 0-9 | 9.5 | 2 | 2 |
| 10-19 | 19.5 | 3 | 5 |
| 20-29 | 29.5 | 4 | 9 |
| 30-39 | 39.5 | 6 | 15 |
| 40-49 | 49.5 | 13 | 28 |
| 50-59 | 59.5 | 10 | 38 |
| 60-69 | 69.5 | 5 | 43 |
| 70-79 | 79.5 | 3 | 46 |
| 80-89 | 89.5 | 2 | 48 |
| 90-99 | 99.5 | 2 | 50 |
(a) 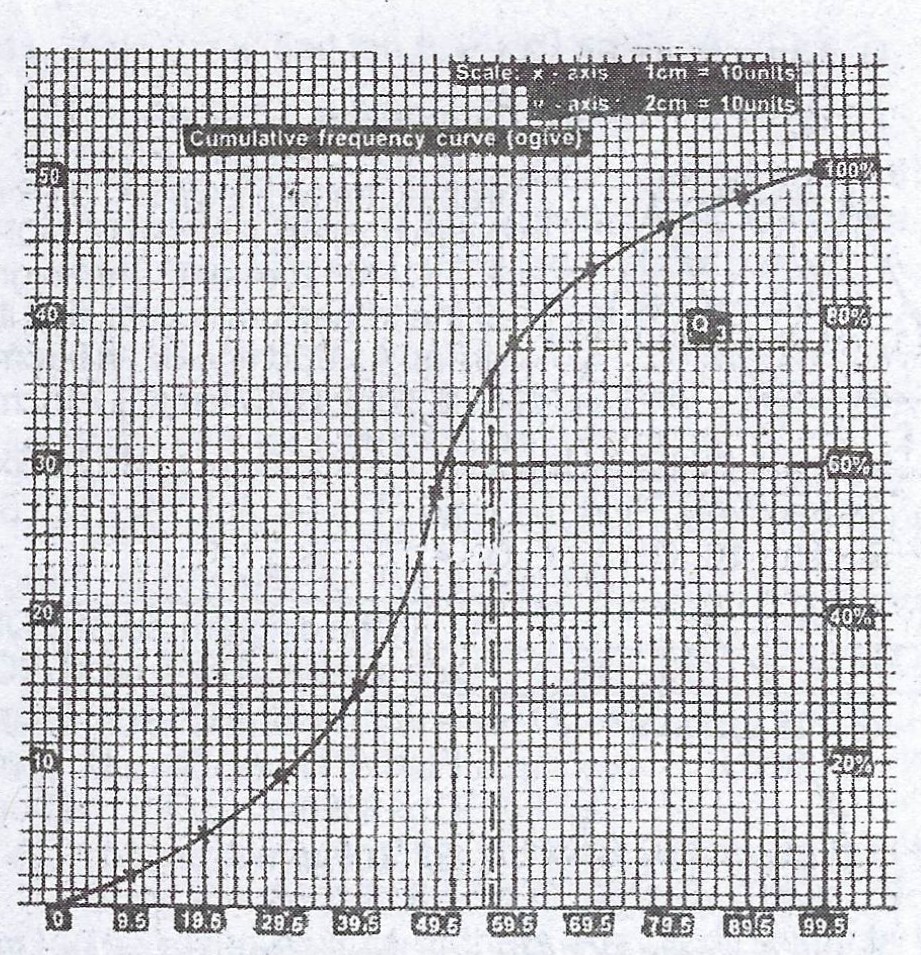
(b)(i) Upper quartile \(Q_{3}\) = 57 marks
(ii) Pass mark if 60% of the class passed = 42 marks


Contributions ({{ comment_count }})
Please wait...
Modal title
Report
Block User
{{ feedback_modal_data.title }}