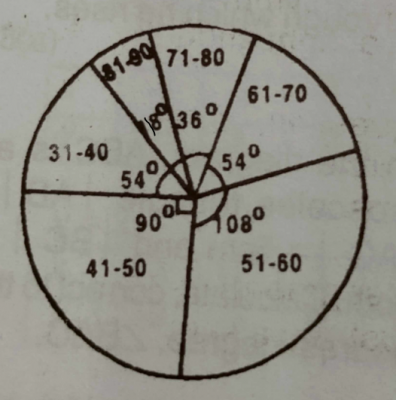
The pie chart above shows the distribution of marks scored by 200 pupils in a test.
(a) How many pupils scored : (i) between 41 and 50 marks? ; (ii) above 80 marks?
(b) What fraction of the pupils scored at most 50 marks?
(c) What is the modal class?


(a)(i) The number of pupils who scored between 41 and 50 marks = \(\frac{90}{360} \times 200 = 50\)
(ii) The angles for pupils above 60 marks = 54° + 36° + 18° = 108°
\(\frac{108}{360} \times 200 = 60\)
(b) The fraction of the pupils who scored at least 50 marks : \(\frac{54 + 90}{360} = \frac{2}{5}\)
(c) The modal class = 51 - 60; It has the largest angle in the pie- chart.


Contributions ({{ comment_count }})
Please wait...
Modal title
Report
Block User
{{ feedback_modal_data.title }}