The ages, in years, of 50 teachers in a school are given below :
21 37 49 27 49 42 26 33 46 40 50 29 23 24 29 31 36 22 27 38 30 26 42 39 34 23 21 32 41 46 46 31 33 29 28 43 47 40 34 44 26 38 34 49 45 27 25 33 39 40
(a) Form a frequency distribution table of the data using the intervals : 21 - 25, 26 - 30, 31 - 35 etc.
(b) Draw the histogram of the distribution
(c) Use your histogram to estimate the mode
(d) Calculate the mean age.


|
Class Interval |
Tally |
Classmark (x) |
Freq (f) |
\(fx\) |
| 21 - 25 | 23 | 7 | 161 | |
| 26 - 30 | 28 | 11 | 308 | |
| 31 - 35 | 33 | 9 | 297 | |
| 36 - 40 | 38 | 9 | 342 | |
| 41 - 45 | 43 | 6 | 258 | |
| 46 - 50 | 48 | 8 | 384 | |
| \(\sum\) | 50 | 1750 |
(b) 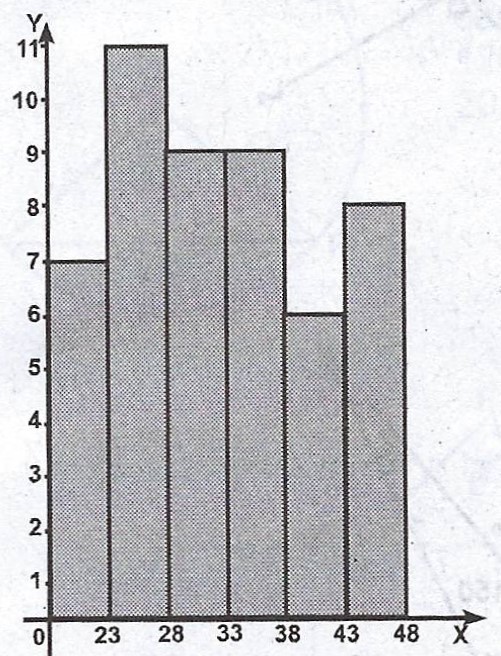
(c) Mode : \(L_{1} + (\frac{f_{0} - f_{1}}{2f_{0} - f_{1} - f_{2}})t\)
Where \(L_{1}\) = lower class boundary of modal class = 25.5
\(f_{0}\) = frequency of modal class = 11
\(f_{1}\) = frequency of pre-modal class = 7
\(f_{2}\) = frequency of post modal class = 9
\(t\) = interval mark = 5.
Mode : \(25.5 + (\frac{11 - 7}{22 - 7 - 9})\times 5 = 25.5 + 3.3\)
= 28.8.
(d) Mean : \(\frac{\sum fx}{\sum f} = \frac{1750}{50}\)
= 35.


Contributions ({{ comment_count }})
Please wait...
Modal title
Report
Block User
{{ feedback_modal_data.title }}