The frequency distribution table shows the marks obtained by 100 students in a Mathematics test.
|
Marks (%) |
1-10 | 11-20 | 21-30 | 31-40 | 41-50 | 51-60 | 61-70 | 71-80 | 81-90 | 91-100 |
| Frequency | 2 | 3 | 5 | 13 | 19 | 31 | 13 | 9 | 4 | 1 |
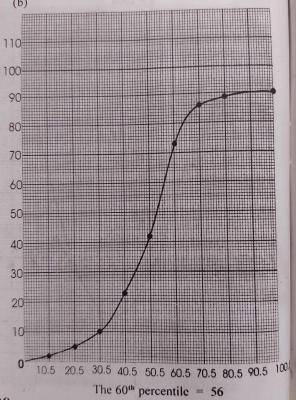
(a) Draw the cumulative curve for the distribution.
(b) Use the graph to find the : (i) 60th percentile ; (ii) probability that a student passed the test if the pass mark was fixed at 35%.
Explanation
Video Explanation
No video available
Post your Contribution
Share:
Discussions (3)

ifeoluwaadesanya370gmail.com
3 years ago
why does myschool not always finish explaining their answers sometimes their answers appear to be wrong. its very bad.
can someone help me explain the solution. for b(ii) what is the final answer?.

