The table shows the marks scored by some candidates in an examination.
| Marks (%) | 0-9 | 10-19 | 20-29 | 30-39 | 40-49 | 50-59 | 60-69 | 70-79 | 80-89 | 90-99 |
| Frequency | 7 | 11 | 17 | 20 | 29 | 34 | 30 | 25 | 21 | 6 |
(a) Construct a cumulative frequency table for the distribution and draw a cumulative frequency curve.
(b) Use the curve to estimate, correct to one decimal place, the :
(i) Lowest mark for distinction if 5% of the candidates passed with distinction ; (ii) probability of selecting a candidate who scored at most 45%.


|
Marks (%) |
frequency (f) |
Cumulative frequency |
Upper class boundaries |
| 0 - 9 | 7 | 7 | 9.5 |
| 10 - 19 | 11 | 18 | 19.5 |
| 20 - 29 | 17 | 35 | 29.5 |
| 30 - 39 | 20 | 55 | 39.5 |
| 40 - 49 | 29 | 84 | 49.5 |
| 50 - 59 | 34 | 118 | 59.5 |
| 60 - 69 | 30 | 148 | 69.5 |
| 70 - 79 | 25 | 173 | 79.5 |
| 80 - 89 | 21 | 194 | 89.5 |
| 90 - 99 | 6 | 200 | 99.5 |
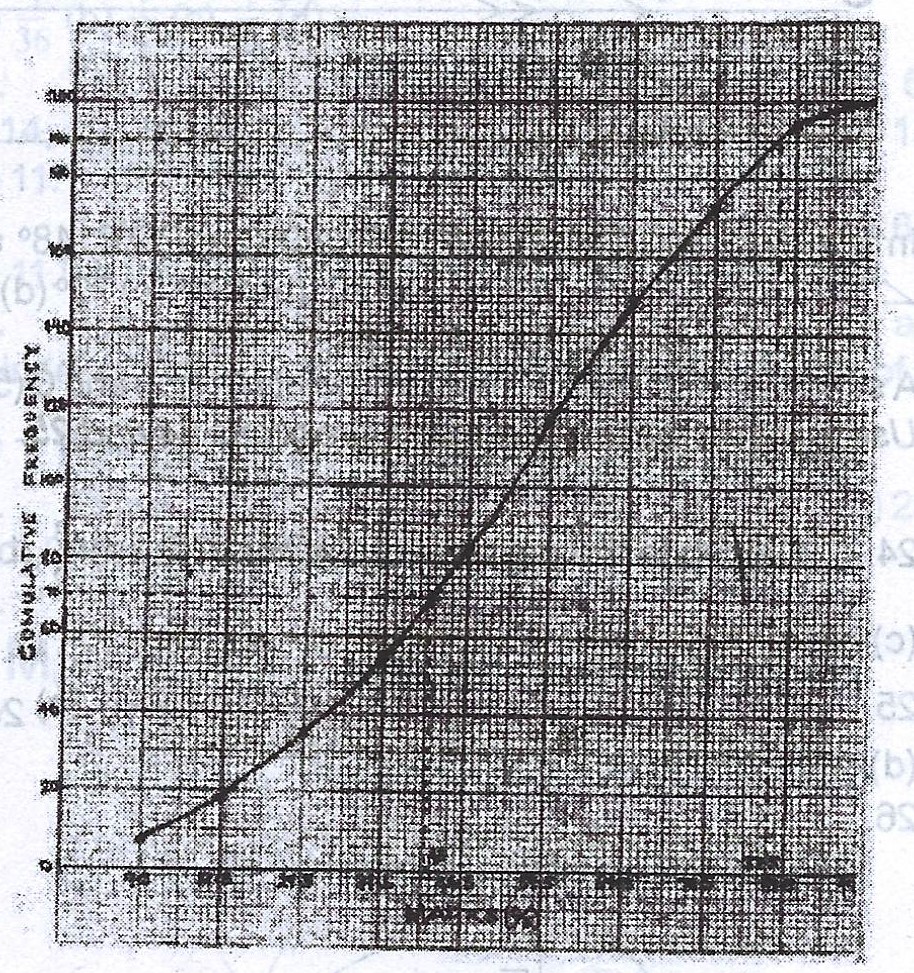
(b) (i) If 5% of the candidates passed the examination, then (100 - 5)% = 95% passed with a mark \(\leq\) the lowest mark for distinction.
\(\text{95% of 200} = \frac{95}{100} \times 200 \)
= 190 candidates. From the ogive, 190 corresponds to 79.5 + 8 = 87.5 marks (to one decimal place)
(ii) From the ogive, the number of candidates who scored at most 45% is 69. Hence, the probability of selecting a candidate who scored at most 45%
= \(\frac{69}{200} = 0.345 \approxeq 0.3\) (1 d.p)


Contributions ({{ comment_count }})
Please wait...
Modal title
Report
Block User
{{ feedback_modal_data.title }}