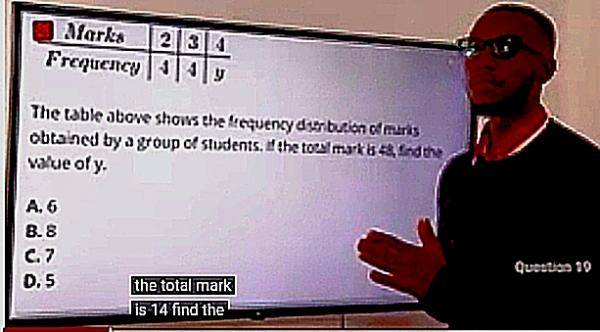
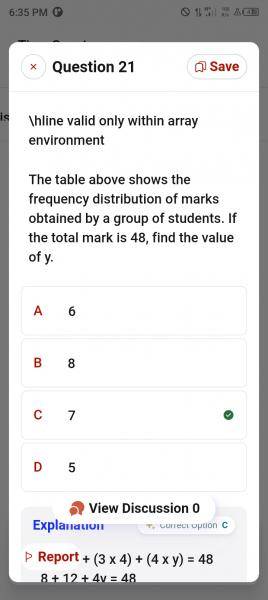
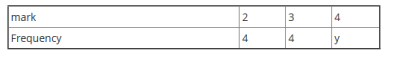
| mark | 2 | 3 | 4 |
| Frequency | 4 | 4 | y |
The table above shows the frequency distribution of marks obtained by a group of students. If the total mark is 48, find the value of y.
a
6
b
8
c
7
d
5
Explanation
Correct Option
cVideo Explanation
Post your Contribution
Share: