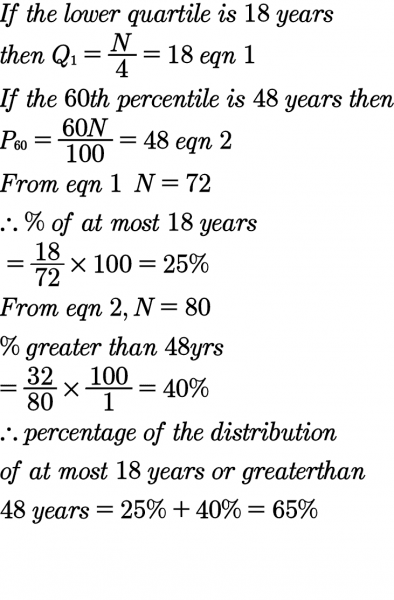
In a cumulative frequency graph, the lower quartile is 18 years while the 60th percentile is 48 years. What percentage of the distribution is at most 18 years or greater than 48 years?
a
15%
b
35%
c
65%
d
85%
Explanation
Correct Option
cNo explanation available
Video Explanation
No video available
Post your Contribution
Share:
Discussions (6)

Dantechsolution
1 year ago
We are given:
Lower quartile (Q1) = 18 years → this corresponds to the 25th percentile, meaning 25% of the data is at most 18 years.
60th percentile = 48 years → meaning 60% of the data is at most 48 years, so 40% is greater than 48 years.
Now, the question asks:
What percentage of the distribution is at most 18 years or greater than 48 years?
This is the union of:
Data at most 18 years = 25%
Data greater than 48 years = 40%
Since these are non-overlapping parts of the distribution, we simply add the two:
25% + 40% = 65%
25%+40%=65%
 Final Answer: 65% of the distribution is at most 18 years or greater than 48 years.


