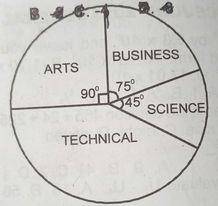
The pie chart shows the distribution of 600 mathematics textbooks for Arts, Business, Science and Technical Classes. What percentage of the total number of textbooks belongs to science?
12\(\frac{1}{2}\)%
\(\frac{205}{6}\)%
25%
\(\frac{412}{3}\)%
Explanation
Video Explanation
No video available
Post your Contribution
Discussions (9)


Please try to make the pictures clearer, that angle looked li 15 not 45 degrees
Here is an explanation:
Another method is: since you know the angle of Science, just put it back in the original formula to get the total number of txt books then you can find the percentage of that. x/600 * 360= 45. Find subject of formula x=(45*600)/360 =75 (This is the total number of science txt books) Then find the percentage 75/600 * 100 =12.5% Option A
REF: New general mathematics ...topic on statistics- Pie chart

