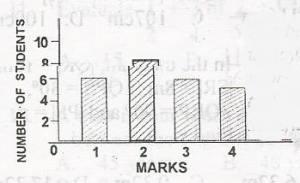
The bar chart shows the frequency distribution of marks scored by students in a class test. What is the median of the distribution?
a
2
b
4
c
6
d
8
Explanation
Correct Option
aVideo Explanation
No video available
Post your Contribution
Share:
Discussions (0)
No comments yet
Be the first to comment

