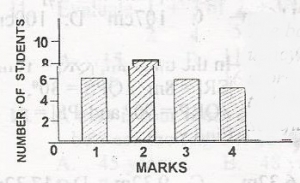
The bar chart shows the frequency distribution of marks scored by students in a class test. Calculate the mean of the distribution.
a
6.0
b
3.0
c
2.4
d
1.8
Explanation
Correct Option
cVideo Explanation
No video available
Post your Contribution
Share:


