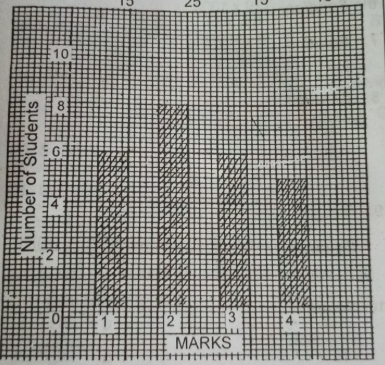
The bar chart shows the frequency distribution of marks scored by students in a class test. How many students are in the class?
a
10
b
24
c
25
d
30
Explanation
Correct Option
cVideo Explanation
No video available
Post your Contribution
Share:
The bar chart shows the frequency distribution of marks scored by students in a class test. How many students are in the class?
10
24
25
30
No video available


