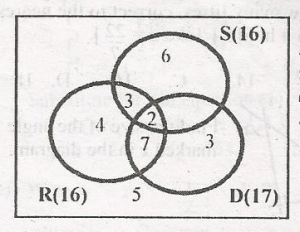
The venn diagram shows the number of students in a class who like reading(R), dancing(D) and swimming(S). How many students like dancing and swimming?

a

7

b

9

c

11

d

13

Download Offline App Ask a Question

Explanation

Correct Option
a

Video Explanation

No video available

Post your Contribution

Share:

Discussions (3)

ini.idara
10 months ago

do you guys actually view reports

ini.idara
10 months ago

answer unavailable

Quick Questions

Ask a Question
CO

ceoofwahala

20th June, 2026

Chemistry


2 comments

ASSAAS

20th June, 2026

English Language


5 comments

infinitehoaxx

21st May, 2026

Computer


4 comments