Mathematics
JAMB 2003
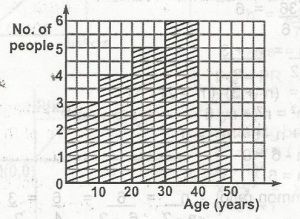
The histogram above shows the ages of victims of a pollution. How many people were involved in the pollution?
Correct Answer: Option A
Explanation
\(\begin{array}{c|c} \text{Age in years} & 10 & 20 & 30 & 40 & 50 \\\hline \text{frequency} & 3 & 4 & 5 & 6 & 2\end{array}\)
\(\sum f \) = number of people involved in the pollution
\(\sum f\) = 3 + 4 + 5 + 6 + 2 = 20
There is an explanation video available below.
Report an Error
Ask A Question
Download App
Explanation Video
Quick Questions


Contributions ({{ comment_count }})
Please wait...
Modal title
Report
Block User
{{ feedback_modal_data.title }}