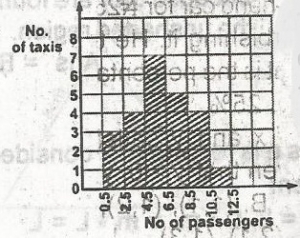
The histogram shows the distribution of passengers in taxis at a certain motor park. How many taxis have more than 4 passengers?


\(\begin{array}{c|c} \text{no. of passengers} & \text{Number of taxis}\\ \hline 0.5 - 2.5 & 3\\ 2.5 - 4.5 & 4 \\ 4.5 - 6.5 & 7\\ 6.5 - 8.5 & 5\\ 8.5 - 10.5 & 4 \\ 10.5 - 12.5 & 1\\ \hline \text{Total} & 24 \end{array}\)
Thus, the taxi with more than 4 passengers
= 7 + 5 + 4 + 1 = 17
There is an explanation video available below.


Contributions ({{ comment_count }})
Please wait...
Modal title
Report
Block User
{{ feedback_modal_data.title }}