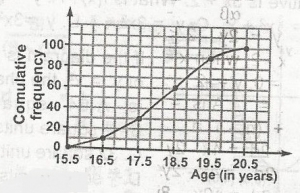
The cumulative frequency curve represents the ages of ages of students in a school. What age group do 70% of the students belongs?


If the total number of students represents 100%, then 70% corresponds to the point on the graph where the cumulative frequency reaches 70
From the graph, find where the cumulative frequency line intersects the 70% mark. This typically corresponds to a specific age on the X-axis
There is an explanation video available below.


Contributions ({{ comment_count }})
Please wait...
Modal title
Report
Block User
{{ feedback_modal_data.title }}