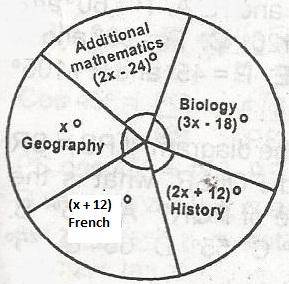
In a class of 60 pupils, the statistical distribution of the numbers of pupils offering Biology, History, French, Geography and Additional mathematics is as shown in the pie chart. How many pupils offer Additional Mathematics?
a
15
b
10
c
18
d
12
e
20
Explanation
Correct Option
bVideo Explanation
No video available
Post your Contribution
Share:
Discussions (4)

teejaycomputer
7 years ago
in the question,French is x-12.......but in d solution worked,French was x+12.......kindly clarify that.


