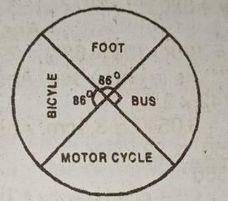
The pie chart above show the distribution of how students travelled to a certain school on a particular day. Use this information to answer the question below
If a hundred students travelled by bus, find the total number of students in the school
a
300
b
400
c
500
d
600
e
750
Explanation
Correct Option
bVideo Explanation
No video available
Post your Contribution
Share:
Discussions (8)

thatsakeenah
3 years ago
the diagram is incomplete. There is supposed to be the 90degree notation on the 'bus sector'. If you check the paper format of the question(waec 1998), the notation is there. Please update the diagram as there's no way to solve it without it(people even commented asking where you got your own 90 from in your solution)


