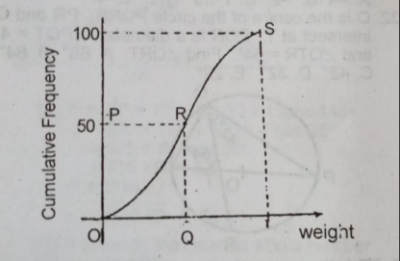
The graph is the cumulative frequency curve for the weight distribution of 100 workers in a factory. Which of the points P,Q,R,S and T indicates the median weight?
a
T
b
S
c
R
d
Q
e
P
Explanation
Correct Option
dVideo Explanation
No video available
Post your Contribution
Share:


