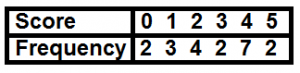
A group of students took a test and the following frequency table shows the scores above
The median score is
o
2.5
3
5
7
Explanation
Video Explanation
No video available
Post your Contribution
Discussions (7)

 The table:
Score 0 1 2 3 4 5
Frequency 2 3 4 2 7 2
 What is the median?
The median is the middle value when all the scores are lined up in order.
But since we have frequencies, we don’t write out every number — we figure out where the middle is using the total count.
 Step 1: Total number of students
Add up all the frequencies:
2+3+4+2+7+2=20
So, 20 students in total.
Step 2: Find the middle position
Since 20 is even, the median is between the 10th and 11th values.
That means we need to find out which score is in the 10th and 11th positions when the scores are ordered.
Step 3: Figure out where those positions land
We’ll go score by score and count how many students have that score:
Score 0: 2 students → positions 1–2
Score 1: 3 students → positions 3–5
Score 2: 4 students → positions 6–9
Score 3: 2 students → positions 10–11
Score 4: 7 students → positions 12–18
Score 5: 2 students → positions 19–20
 Final step: What score is in position 10 and 11?
Answer: Score 3 is in positions 10 and 11.
So the median = 3


my diagram is showing but I feel like it's a wrong one. Because it's not corresponding with the question.

