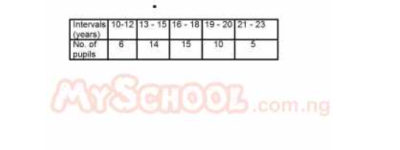
The table above shows the frequency distribution of the ages (in years) of pupils in a certain secondary school. What percentage of the total number of pupils is over 15 years but less than 21 years?
a
35%
b
45%
c
50%
d
60%
Explanation
Correct Option
c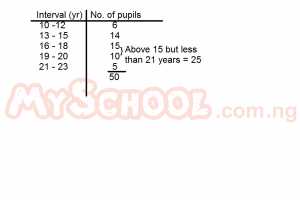
Video Explanation
No video available
Post your Contribution
Share:


