The countries listed in Table X below contributed money as indicated for a joint project in the year 2017. Use the data in the table to answer the questions that follow.
Country Amount Contributed
A
B
C
D
E
Represent the data in Table X on a vertical divergent bar graph. (b) State one use of divergent bar graph.


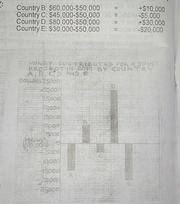
(a) Divergent bar graph:
Average of the contributions = $50,000
Country A: $35,000-$50,000 = -$15,000
Country B: $60,000-$50,000 = +$10,000
Country C: $45,000-$50,000 = -$5,000
Country D: $80,000-$50,000 = +$30,000
Country E: $30,000-$50,000 = -$20,000
(b) Uses of divergent bar graph: - for summarizing large amount of data in visual form, - for presenting data in graphical form; - for plotting climatic data; -to show the economic importance of an enterprise over the years; - to show the performance of a sector within an economy; - to make data more meaningful and vivid; - for inter-regional comparison on similar items; - for showing the statuses of Some social economic variables of a country, - to show deviation of data from a common mean, - to prevent data in attractive and moremind-engaging form, to make easy, the understanding of the relative standing/values of groups of data.


Contributions ({{ comment_count }})
Please wait...
Modal title
Report
Block User
{{ feedback_modal_data.title }}