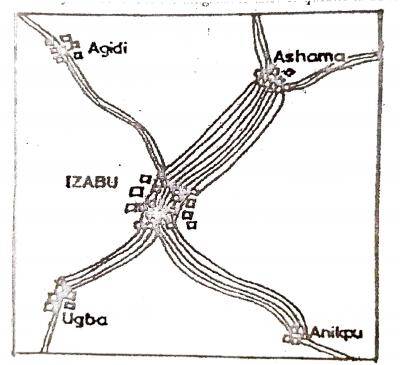
The image below shows the volume and direction of passenger traffic between IZABU town and its surrounding towns in the year 2001.
Scale: 1 line represents 1,500 persons
Which of the following statistical methods is represented above?
A.
Dot map
B.
Isohaline map
C.
Flow chart
D.
Bar chart
Correct Answer: Option C
Explanation
No official explanation is available for this question at this time. Please check contributions posted by others below. If you can provide an explanation to help other student learn, please click here


Contributions ({{ comment_count }})
Please wait...
Modal title
Report
Block User
{{ feedback_modal_data.title }}