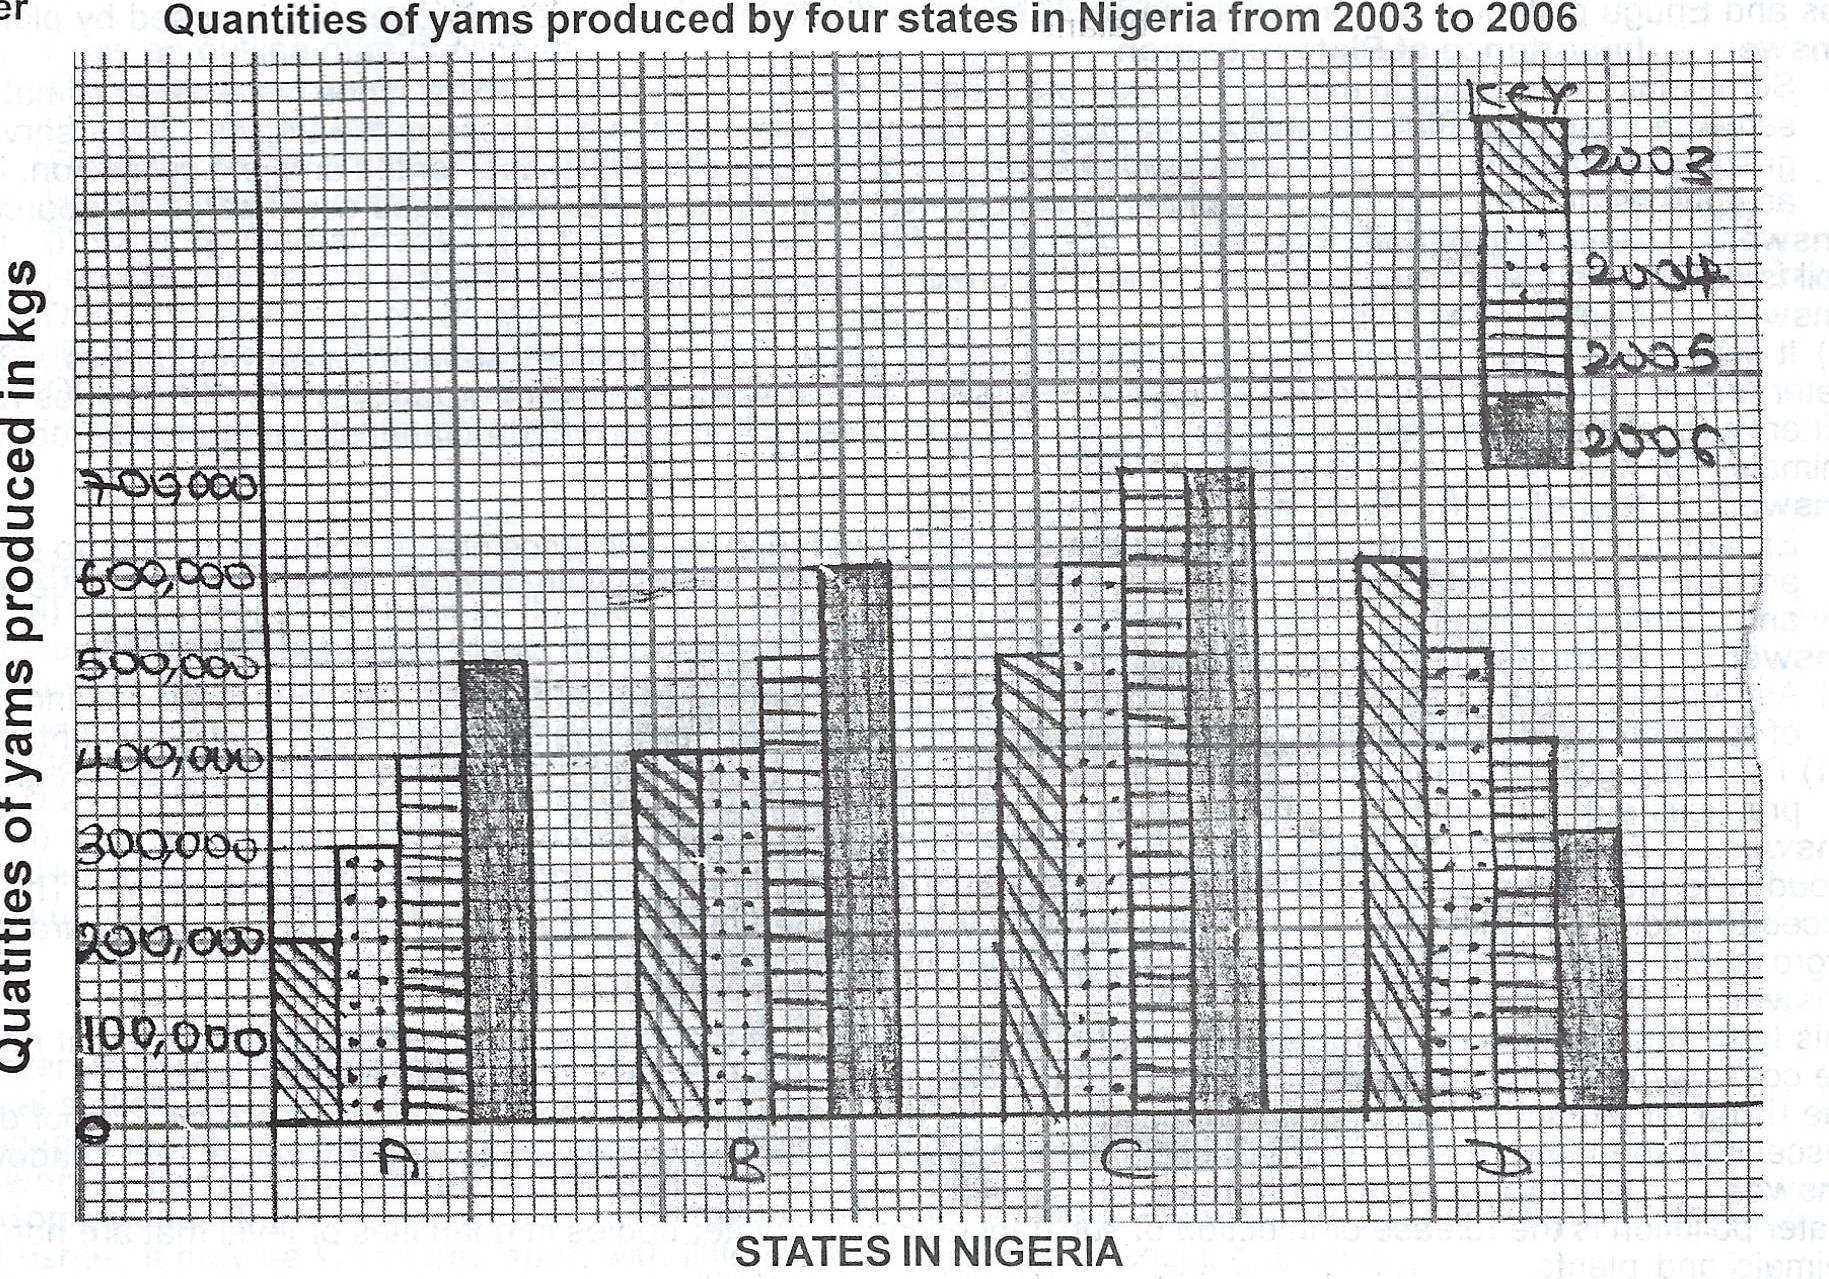
The table below shows the quantity of yams in kilogram produced by four yam producing states in country X between 2003 and 2006.
| state | 2003 | 2004 | 2005 | 2006 |
| A | 200,000 | 300,000 | 400,000 | 500,000 |
| B | 400,000 | 400,000 | 500,000 | 600,000 |
| C | 500,000 | 600,000 | 700,000 | 700,000 |
| D | 600,000 | 500,000 | 400,000 | 300,000 |
(a) Draw a comparative I group bar graph to represent the statistics.
(b) State two advantages of using comparative I group bar graphs in showing statistics.
(c) Name one other method that can be used in showing the statistics.


(b) Advantages of using comparative bar graph in statistics.
(1) Makes for easy comparison of items.
(2) Makes for easy computation of items.
(3) Gives vivid impression of the quantities involved.
(4) Can be used to represent a wide range of economic, social and geographical data.
(c) Answer Other methods that can be used in showing the statistics.
(i) Divided bar graph or composite bar graph.


Contributions ({{ comment_count }})
Please wait...
Modal title
Report
Block User
{{ feedback_modal_data.title }}