

The Table below shows the volume of air passenger traffic between Lagos and four other cities in Nigeria in 1985. Study the table and use the data in it to answer the questions that follow:
| S/N | Route | No. of passengers |
| 1 | Lagos - Abuja | 500,000 |
| 2 | Lagos - Enugu | 200,000 |
| 3 | Lagos - Port Harcourt | 400,000 |
| 4 | Lagos - sokoto | 300,000 |
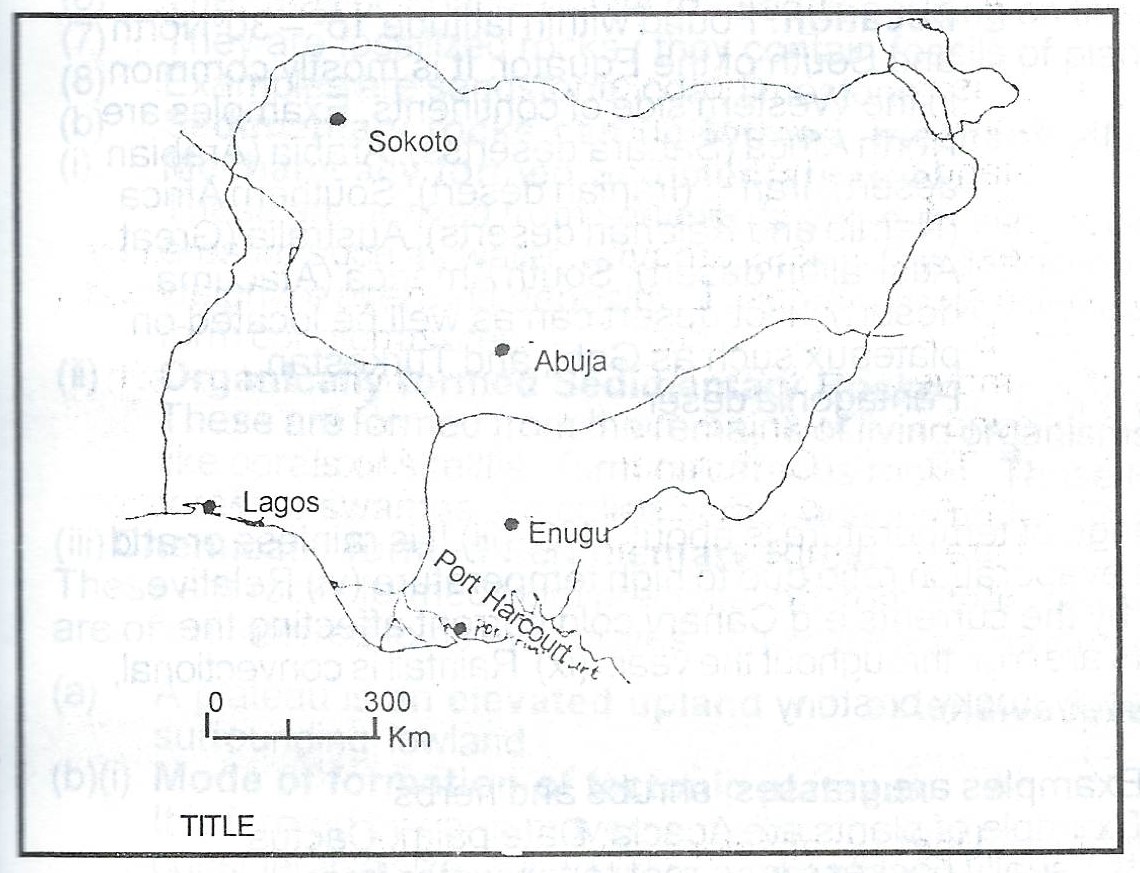
(a) Using the attached map of Nigeria - Map B, construct a flow map/chart to represent the data in Table 1.
(b) State two advantages cf representing data with flow maps.

(a) Title: Volume of air passenger traffic flow between Lagos and four other cities in Nigeria, 1985.
Scale: 1 mm represent 50,000 passengers. Lagos —Abuja will be represented by 500,000 = 10mm
50,000
Lagos - Enugu will be represented by 200,000 4mm
50,000
Lagos - Port Harcourt will be represented by 400,000 8mm
50,000
Lagos - Sokoto will be represented by 300,000
50,000
The flow map /chart
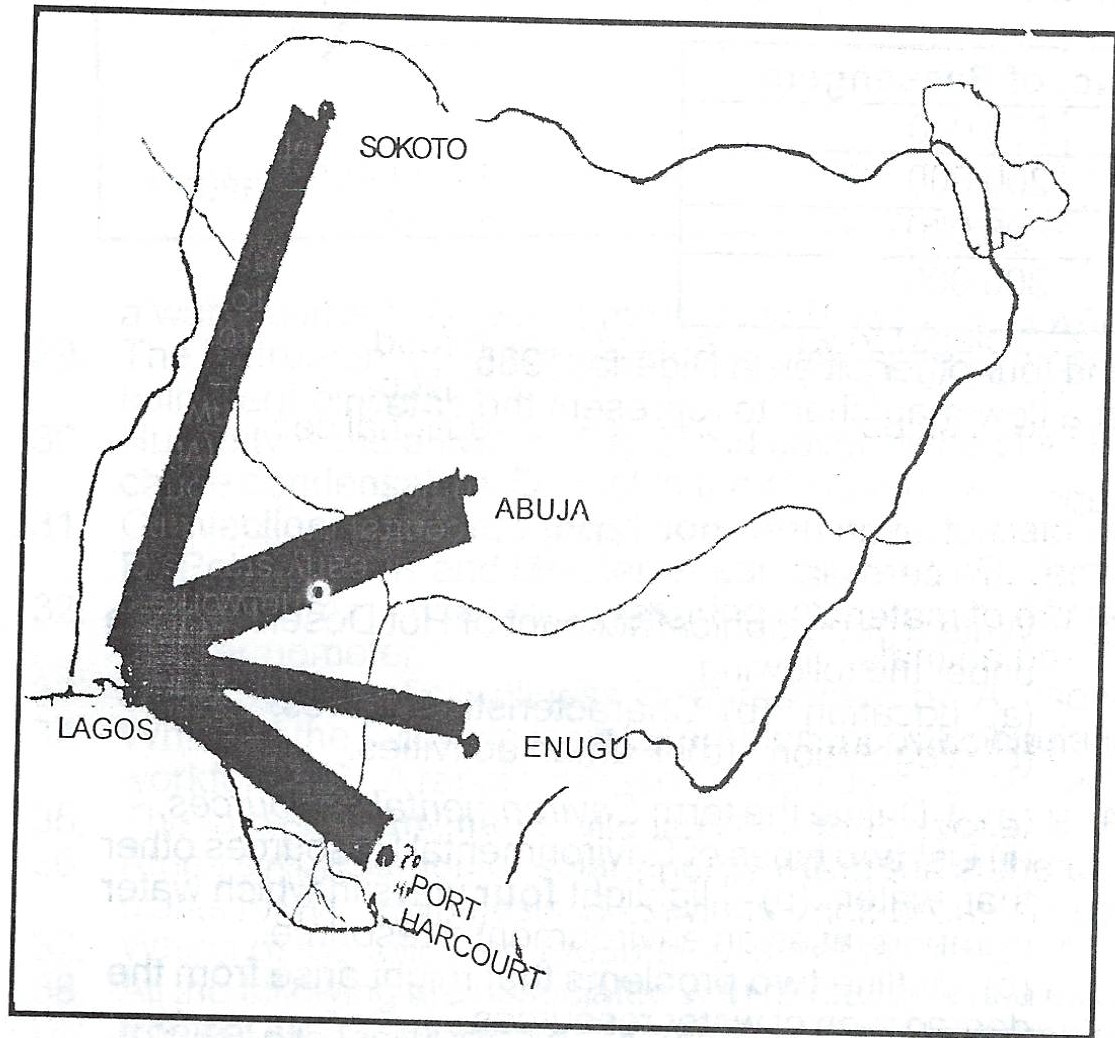
Title: Volume of air passenger traffic flow between Lagos and four other cities in Nigeria, 1985.
Scale: lcm represent 50,000 passengers
(b) Advantages of flow maps
(i) Flow maps give vivid impression of the traffic flow between two stations
(ii) The size of the bands or number of lines gives impression of the volume of traffic
(iii) Factual information may also be written on the flow line or along side it.
(iv) It is the most commonly used method of representing movement
(v) Easy to compare from the thickness of the band.


Contributions ({{ comment_count }})
Please wait...
Modal title
Report
Block User
{{ feedback_modal_data.title }}