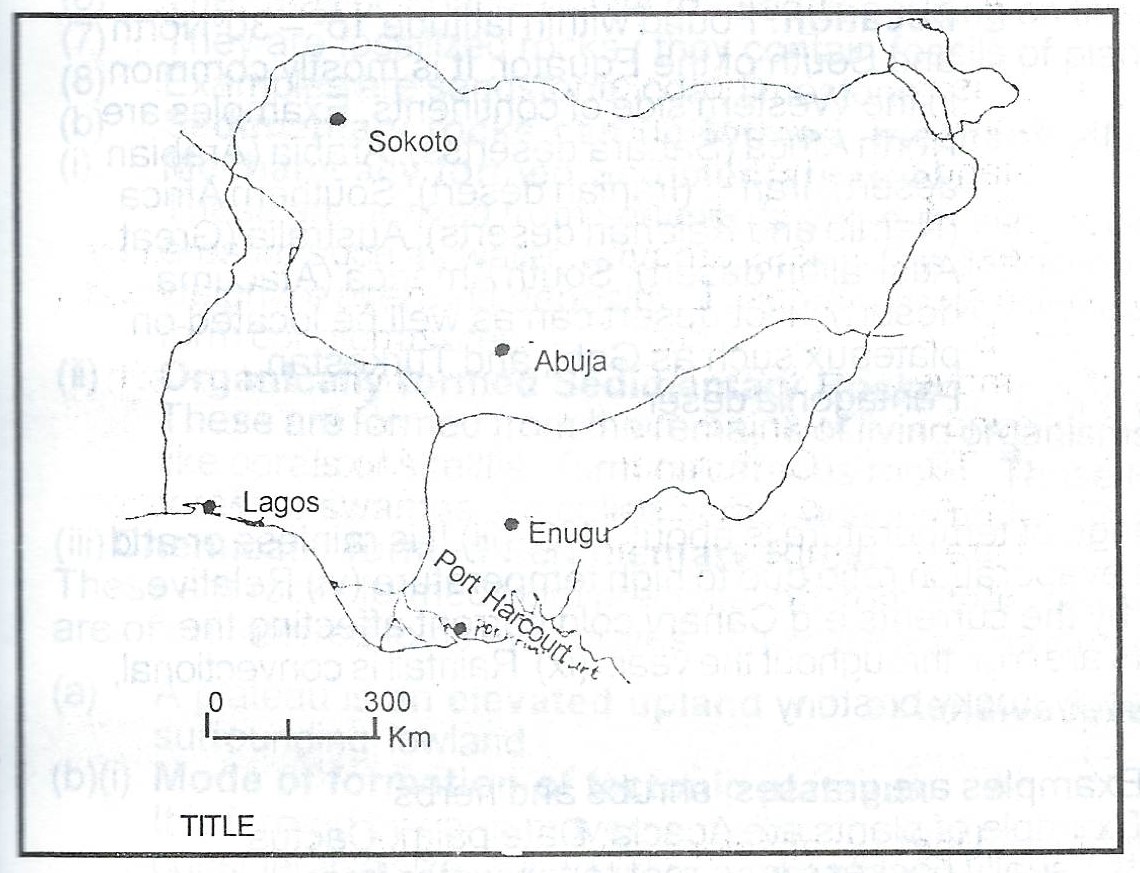
The Table below shows the volume of air passenger traffic between Lagos and four other cities in Nigeria in 1985. Study the table and use the data in it to answer the questions that follow:
| S/N | Route | No. of passengers |
| 1 | Lagos - Abuja | 500,000 |
| 2 | Lagos - Enugu | 200,000 |
| 3 | Lagos - Port Harcourt | 400,000 |
| 4 | Lagos - sokoto | 300,000 |
(a) Using the attached map of Nigeria - Map B, construct a flow map/chart to represent the data in Table 1.
(b) State two advantages cf representing data with flow maps.
Explanation
Video Explanation
No video available
Post your Contribution
Share:
Discussions (0)
No comments yet
Be the first to comment

