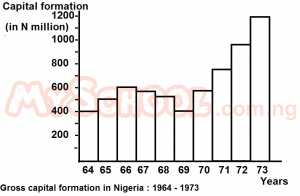
The histogram above shows a steady growth of gross capital formation occurred between
A.
1967 and 1971
B.
1964 and 1968
C.
1969 and 1973
D.
1966 and 1970
Correct Answer: Option C
Explanation
No official explanation is available for this question at this time. Please check contributions posted by others below. If you can provide an explanation to help other student learn, please click here


Contributions ({{ comment_count }})
Please wait...
Modal title
Report
Block User
{{ feedback_modal_data.title }}