13a. The table below shows the distribution of hours spent at work by the employees of a factory in a week
| Time(hours) | 20 - 29 | 30 - 39 | 40 - 49 | 50 - 59 | 60 - 69 | 70 - 79 |
| No. of persons | 8 | 11 | 23 | 25 | 8 | 5 |
Draw an Ogive for the distribution
b. Using your graph, estimate
i. the median.
ii. estimate the lower quartile
iii. 40th percentile
iv. number of employees that spent at least 50 hours 30 mins.


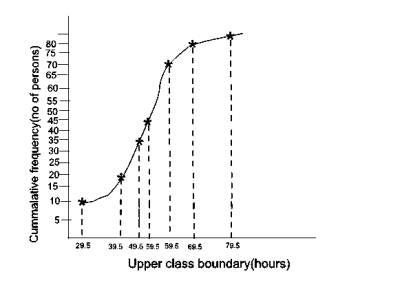
| Time(hours) | Frequency | Cumulative frequency | Upper boundary |
| 20-29 | 8 | 8 | 29.5 |
| 30-39 | 11 | 19 | 39.5 |
| 40-49 | 23 | 42 | 49.5 |
| 50-59 | 25 | 67 | 59.5 |
| 60-69 | 8 | 75 | 69.5 |
| 70-79 | 5 | 80 | 79.5 |
b. Median = (\(\frac{ n + 1}{2}\))\(^{th}\) data
Median = \(\frac{80 + 1}{2}\) = \(\frac{81}{2}\) = 40.5th
So, from the graph, the median is 48.8 hours.
ii. Lower quartile, Q\(_1\) = (\(\frac{n + 1}{4}\))\(^{th}\) data
Q\(_1\) = \(\frac{80 + 1}{4}\) = \(\frac{81}{4}\) = 20.25th data
Q\(_1\) = 40 hours from the graph
iii. 40th percentile
= \(\frac{40}{100}\) x 80 = 32\(^{nd}\) data.
From the graph, 40th percentile = 45.5 hours.
iv. The number of employees who spent at least 50 hours 30 mins = 32.


Contributions ({{ comment_count }})
Please wait...
Modal title
Report
Block User
{{ feedback_modal_data.title }}