The table shows the distribution of distance (in km) of 60 villages from a state capital.
| Distance (in km) | 0 - 19 | 20 - 29 | 30 - 39 | 40 - 49 | 50 - 59 | 70 - 99 | 100 - 149 |
| Number of villages | 12 | 7 | 6 | 8 | 5 | 9 | 10 |


| Distance | Class size | Frequency | Frequency density | Class boundary |
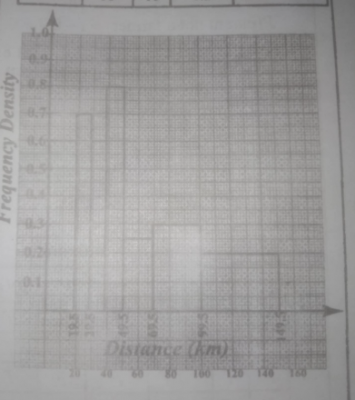
| 0 - 19 | 20 | 12 | 0.6 | - 0.5 - 19.5 |
| 20 - 29 | 10 | 7 | 0.7 | 19.5 - 29.5 |
| 30 - 39 | 10 | 6 | 0.6 | 29.5 - 39.5 |
| 40 - 49 | 10 | 8 | 0.8 | 39.5 - 49.5 |
| 50 - 69 | 20 | 5 | 0.25 | 49.5 - 69.5 |
| 70 - 99 | 30 | 9 | 0.3 | 69.5 - 99.5 |
| 100 - 149 | 50 | 10 | 0.2 | 99.5 - 149.5 |
(NOTE): Frequency density = \(\frac{\text{frequency}}{\text{Class size}}\)
SEE THE DIAGRAM ABOVE


Contributions ({{ comment_count }})
Please wait...
Modal title
Report
Block User
{{ feedback_modal_data.title }}