

The table below shows the corresponding values of two variables X and Y.
| X | 33 | 31 | 28 | 25 | 23 | 22 | 19 | 17 | 16 | 14 |
| Y | 4 | 6 | 4 | 10 | 12 | 10 | 14 | 15 | 18 | 22 |
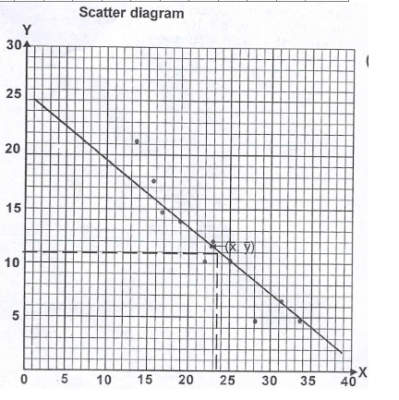
(a) Plot a scatter diagram to represent the data.
(b) Calculate \(\bar{x}\), the mean of X and \(\bar{y}\), the mean of Y.
(c) Draw the line of best fit to pass through \((\bar{x}, \bar{y})\).
(d) From your graph in (c), determine the (i) relationship between X and Y ; (ii) value of Y when X is 24.

| X | 33 | 31 | 28 | 25 | 23 | 22 | 19 | 17 | 16 | 14 | 228 |
| Y | 4 | 6 | 4 | 10 | 12 | 10 | 14 | 15 | 18 | 22 | 115 |
See the scatter diagram above
(b) \(\bar{x} = \frac{\sum X}{N} = \frac{228}{10} = 22.8\)
\(\bar{y} = \frac{\sum Y}{N} = \frac{115}{10} = 11.5\)
(c) See graph above.


Contributions ({{ comment_count }})
Please wait...
Modal title
Report
Block User
{{ feedback_modal_data.title }}