

The table shows the frequency distribution of marks scored by some candidates in an examination.
| Marks | 0-9 | 10-19 | 20-29 | 30-39 | 40-49 | 50-59 | 60-69 | 70-79 | 80-89 | 90-99 |
| Freq | 2 | 5 | 8 | 18 | 20 | 15 | 5 | 4 | 2 | 1 |
(a) Draw the cumulative frequency curve of the distribution.
(b) Use your graph to estimate the :
(i) semi-interquartile range of the distribution; (ii) percentage of candidates who passed with distinction if the least mark for distinction was 72.


| Marks | Class boundaries | Freq | Cum Freq |
| 0-9 | 0 - 9.5 | 2 | 2 |
| 10 - 19 | 9.5 - 19.5 | 5 | 7 |
| 20 - 29 | 19.5 - 29.5 | 8 | 15 |
| 30 - 39 | 29.5 - 39.5 | 18 | 33 |
| 40 - 49 | 39.5 - 49.5 | 20 | 53 |
| 50 - 59 | 49.5 - 59.5 | 15 | 68 |
| 60 - 69 | 59.5 - 69.5 | 5 | 73 |
| 70 - 79 | 69.5 - 79.5 | 4 | 77 |
| 80 - 89 | 79.5 - 89.5 | 2 | 79 |
| 90 - 99 | 89.5 - 99.5 | 1 | 80 |
(a) 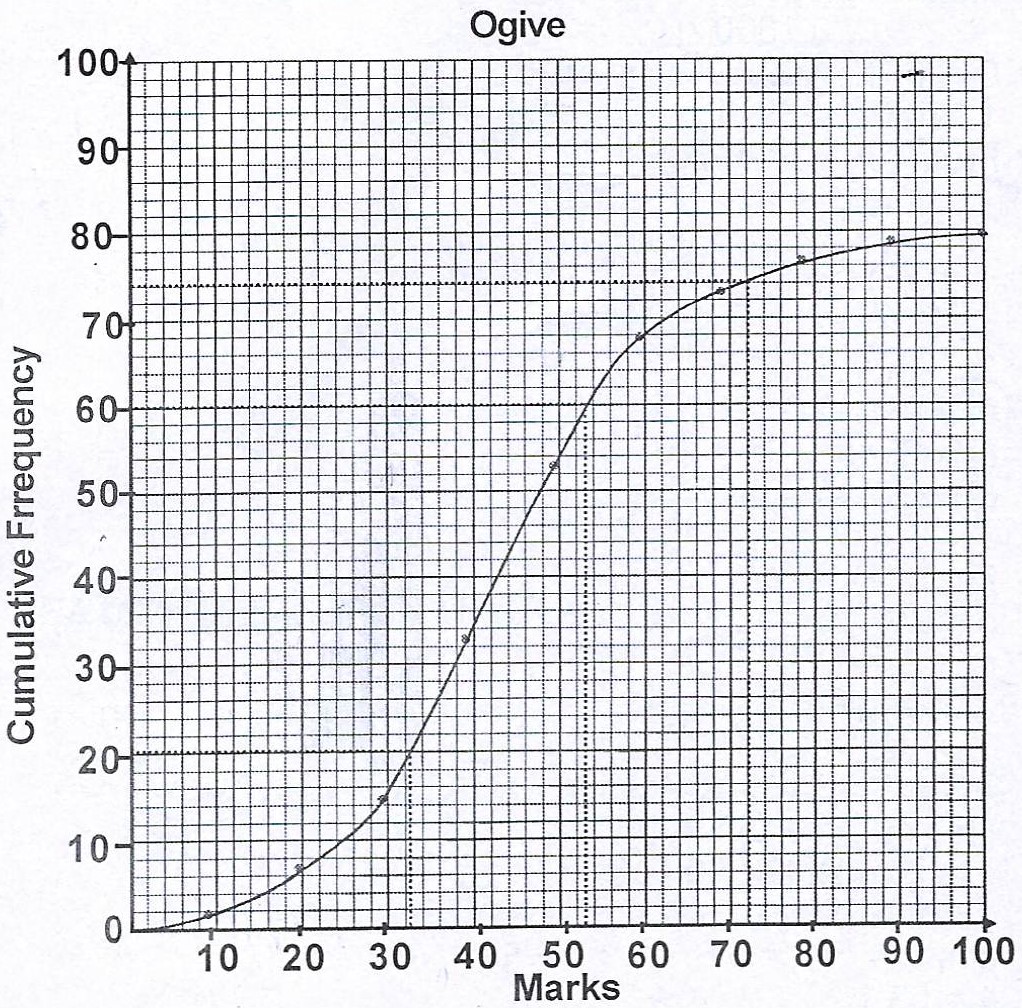
(b)(i) Lower quartile, \(Q_{1} = 32.5\)
Upper quartile, \(Q_{3} = 53.0\)
Semi-interquartile range = \(\frac{1}{2} (Q_{3} - Q_{1})\)
= \(\frac{1}{2} (53.0 - 32.5) = \frac{1}{2} (20.5)\)
= \(10.25\)
(ii) Number of students that passed with distinction = (80 - 74)
= 6 students
Percentage = \(\frac{6}{80} \times 100% = 7.5%\)


Contributions ({{ comment_count }})
Please wait...
Modal title
Report
Block User
{{ feedback_modal_data.title }}