The table shows the heights in cm of some seedlings in a certain garden.
| Height (cm) | 36-40 | 41-45 | 46-50 | 51-55 | 56-60 |
| Frequency | 3 | 9 | 21 | 12 | 5 |
(a) Draw the cumulative frequency curve for the distribution.
(b) Using the curve in (a), find thesemi-interquartile range.


| Height (cm) | Freq | Class boundaries | Cum. freq |
| 36 - 40 | 3 | 35.5 - 40.5 | 3 |
| 41 - 45 | 9 | 40.5 - 45.5 | 12 |
| 46 - 50 | 21 | 45.5 - 50.5 | 33 |
| 51 - 55 | 12 | 50.5 - 55.5 | 45 |
| 56 - 60 | 5 | 55.5 - 60.5 | 50 |
(a) 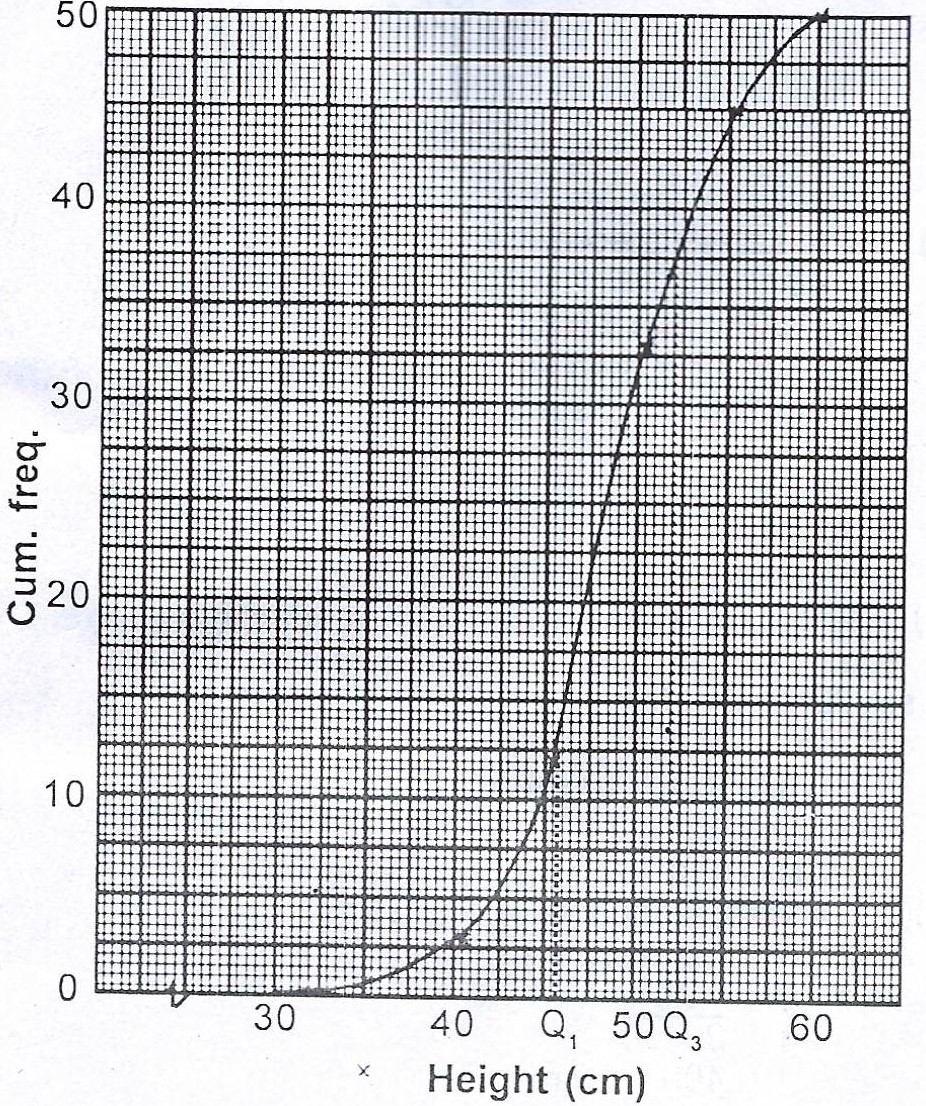
(b) Lower quartile \(Q_{1}\) = 45.6cm
Upper quartile \(Q_{3}\) = 52.0cm
Semi- interquartile range = \(\frac{Q_{3} - Q_{1}}{2}\)
= \(\frac{52 - 45.6}{2}\)
= \(\frac{6.4}{2}\)
= \(3.2cm\)


Contributions ({{ comment_count }})
Please wait...
Modal title
Report
Block User
{{ feedback_modal_data.title }}