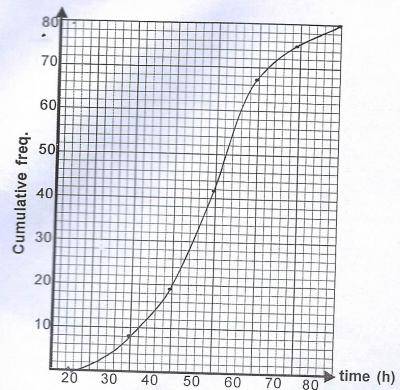
The table shows the distribution of hours spent at work by the employees of a factory in a week.
| Time (in hours) | 20 - 29 | 30 - 39 | 40 - 49 | 50 - 59 | 60 - 69 | 70 - 79 |
| No of persons | 8 | 11 | 23 | 25 | 8 | 5 |
(a) Draw an ogive for the distribution.
(b) Using your graph, estimate the (i) lower quartile (ii) median (iii) 40th percentile (iv) number of employees that spent at least 50 hours 30 minutes at work.
Explanation
Video Explanation
No video available
Post your Contribution
Share:
Discussions (0)
No comments yet
Be the first to comment

