-
A.
structural unemployment
-
B.
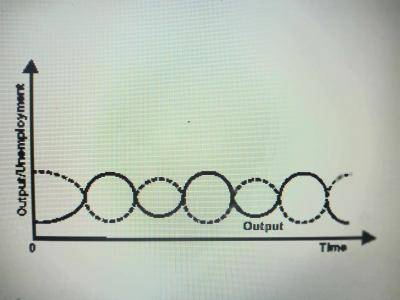
cyclical unemployment
-
C.
volunatary unempployment
-
D.
frictional unemployment
Correct Answer: Option B
Explanation
The dotted line in the graph above represent the upturn and downturn of the econonmy. Therefore, the diagram is cyclical unemployment.
Report an Error
Ask A Question
Download App
Quick Questions


Contributions ({{ comment_count }})
Please wait...
Modal title
Report
Block User
{{ feedback_modal_data.title }}