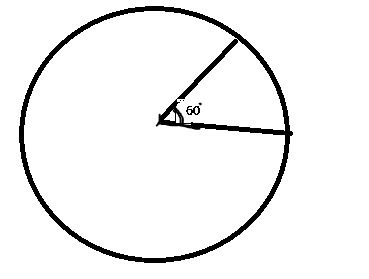
The pie chart above represents the total population of a school of 1,200. The shaded area of 60º shows the population of the underaged pupils.
What is the population of the matured students?
a
600
b
800
c
1000
d
1200
Explanation
Correct Option
cVideo Explanation
No video available
Post your Contribution
Share:


