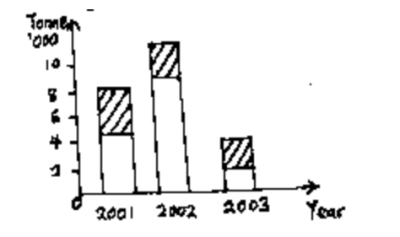
Use the figure below to answer the question that follows
What does the diagram above depict


A component bar chart is used to represent data in which the total magnitude is divided into different or components with each component, or part, of the bar is shaded differently.


Contributions ({{ comment_count }})
Please wait...
Modal title
Report
Block User
{{ feedback_modal_data.title }}