(a) Distinguish between the following pairs of concepts:
(i) elastic demand and inelastic demand
(ii) income elasticity of demand and cross elasticity of demand.
(b) Using diagrams, explain how an increase in price will affect the total revenue of a producer if the demand for his product is:
(i) price elastic;
(ii) price elastic


(a)(i) Demand is elastic if a change in the price of a commodity results in a more than proportionate change in quantity demanded. On the other hand, demand is inelastic if a change in the price of a commodity results in a less than proportionate change in quantity demanded.
(ii) Income elasticity of demand refers to the degree of responsiveness of quantity demanded of a commodity to a change in the income of the consumer.
Cross elasticity of demand on the other hand is the degree of responsiveness of quantity demanded of one commodity to a change in the price of another commodity.
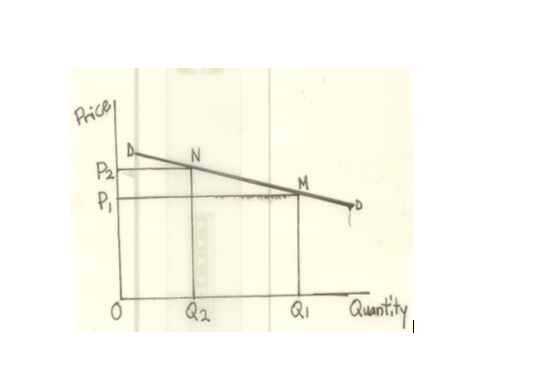
(b)(i) If the demand is elastic, an increase in price will result in a more than proportionate fall in quantity demanded. By this, the producer’s revenue will fall.
As shown in the diagram below, quantity demanded falls from 0Q1 to 0Q2 after the price increased from 0P1 to 0P2 .
TR before the price increase is area of rectangle 0P1MQ1. TR after the price increase is the area of rectangle 0P2NQ2. Clearly, 0Q1MP1 > 0Q2NP2 .i.e. TR1 > TR2
 (ii) If the demand is inelastic, an increase in price will result in a less than proportionate fall in quantity demanded. By this, the producer’s total revenue will rise. As shown in the diagram below, quantity demanded falls from 0Q1 to 0Q2 after price increased from 0P1 to 0P2 .
TR before the price increase was the area of rectangle OP1TQ1.TR after the price increase is the area of rectangle 0P2SQ2.
Clearly 0P1TQ1<0P2SQ2.i.e. TR1 < TR2.


Contributions ({{ comment_count }})
Please wait...
Modal title
Report
Block User
{{ feedback_modal_data.title }}