The pie chart below shows the age distribution of population in thousands of an island Y for the year 2000 The total population of the island is 245,000.
Use the information supplied to answer the questions that follow (Show all workings clearly)
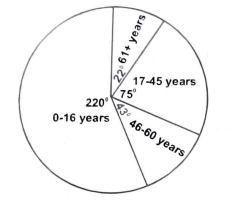
(a) Calculate the number of persons in the different age groups
(b) What is the dependency ratio of the population?
(c) Give three implications of the above population structure
Explanation
Video Explanation
No video available
Post your Contribution
Share:
Discussions (0)
No comments yet
Be the first to comment

