

The table below shows the natural growth gowth rate of the population of country N over a period of time. Use the information contained in the table to answer the following questions.
| Year | Birth Rate per '000 | Death Rate per '000 | Natural Growth Rate |
| 1971 | 45 | 32 | L |
| 1972 | 39 | P | 12.50 |
| 1973 | 26 | 22 | Q |
| 1974 | R | 22.50 | 4.50 |
| 1975 | 26.50 | 22.50 | S |
| 1976 | 20.50 | T | 3.00 |
(a) Determine L. P, Q, R, S and T. [6 marks]
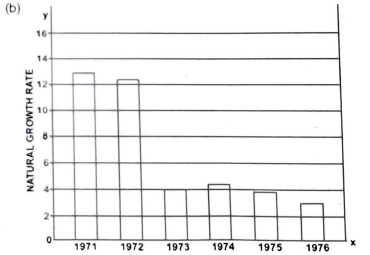
(b) With the use of a bar chart, graphically present the changes in the natural growth rate over the years. (Use of graph sheet is essential) [8 marks]
(c) Outline any three reasons for changes in birth rate. [6 marks]

(a) Birth rate - Death rate = Natural growth rate
L = 45 -32 = 13
P = 39 - 12.50 = 26.50
Q = 26 - 22 = 4
R = 22.50 + 4.50 = 27
S = 26.50 - 22.50 = 4
T = 20.50 - 3 = 17.50
(c) (i)Early or late marriages: Early marriages increase birth rates while late marriages reduce it.
(ii) The higher the number of females in a population the higher the birth rate and vice versa
(iii) Population control methods and campaigns can also reduce birth rates.
(iv) Improved medical facilities Increase birth rates.
(v) Changes in traditional attitudes and beliefs of people to have large families can reduce birth rates.
(vi) Improved economic situations can affect birth rates particularly in developing societies.


Contributions ({{ comment_count }})
Please wait...
Modal title
Report
Block User
{{ feedback_modal_data.title }}